PRILINK delivers the primary link of Network Traffic Analytics (NTA) in the cloud as well as onsite. Users can now monitor and trace cloud traffic with ease as if it is local. We bring the cloud closer to you.
Getting NTA is easy and non-intrusive. It starts from launching t-meters in the cloud or onsite, then finishes by installing a standalone Windows application for collecting data. As an option, you can add NTA to your dashboard using API or stream it to the cloud for team collaboration.
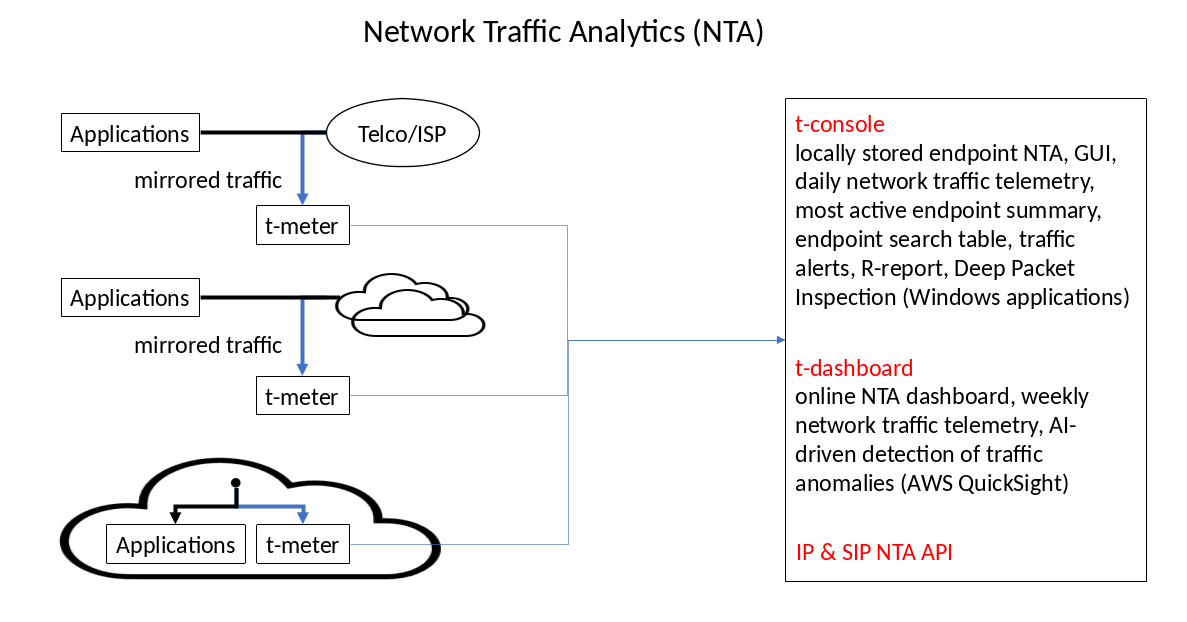
t-meter analyzes mirrored SIP Trunk and Internet traffic in real-time. It compiles NTA for all endpoints covering network layer 2 to 4, SRTP, SIP and RTP that advance contact centre and UC operations. You can account for hidden call blockage, evaluate WebRTC QoS based on SRTP packet loss, analyze omnichannel network traffic from Internet, trace IP or SIP session from the network demarcation point, and much more.
Contact Us ![]() Video: Setting up Network Traffic Analytics for AWS and Contact Centre
Video: Setting up Network Traffic Analytics for AWS and Contact Centre
| t-meter is a small network appliance, connecting to the mirror ports of edge-routers or switches. It compiles NTA in real-time at up to 10 Gbps. Our NTA are compact in size requiring little transfer bandwidth to the cloud or directly to your Windows PC or server. | |
| V-t meter is a virtual version of t-meter that can be launched in one-click inside the cloud. It is lightweight requiring only 2 vcpu and 2 GB ram. It can analyze mirrored traffic from VXLAN or GRETAP tunnel, at up to 10 Gbps. | |
| T-console is a standalone network DevOps tool running on Winows OS. It collects NTA for daily business reports, and with years’ worth of data you can count on it for ad hoc network forensic. When tackling evasive network issues, you can immediately zoom in to capture IP packets for DPI. |
| SIP NTA dashboard and weekly network traffic telemetry is an online network perspective of UC and CC operations stretched over 14 days. It reveals hidden call blockage, quality issues and granular call traffic trends that are necessary for team collaboration to ensure agile business operations. | |
| IP NTA dashboard and weekly network traffic telemetry moves at the same speed of ever-changing apps over the network. It is an online view of what matter in network performance, security and endpoint activities. Also, dashboard highlights the differences between daily and weekly trends, you can be sure of any traffic anomalies at a glance. | |
| NTA API for SIP and IP is available for developers, Learn more | |