Demarc Network Traffic Monitor

In today’s highly connected environment, business operates on top of network. Do you have network monitoring that is lightweight, yet capable of real-time traffic alerts and tracking all IP and SIP endpoints at Demarc.
Prilink Demarc Network Traffic Monitor (DNTM) provides Network Traffic Analytics (NTA) based on network traffic mirroring. It is simple, minimal in logistics and zero-touch to application servers. At the network demarcation point (Demarc), our t-meter analyzes network protocols in real-time and transfers compact NTA to you without the needs for high bandwidth and extra storage buffers. Adapted for mobile workforce, DNTM features real-time SMS alerts and intuitive network traffic telemetry in the cloud accessible anytime anywhere.
DNTM user interface is composed of SMS-alert, t-console and t-dashboard that brings network under your control:
1. SMS-alert is based on what is actually happening at Demarc rather than inside application servers. It is real-time, independent and can be setup to monitor events such as emergency calls, IP endpoint traffic anomalies, peak SIP session threshold and more.
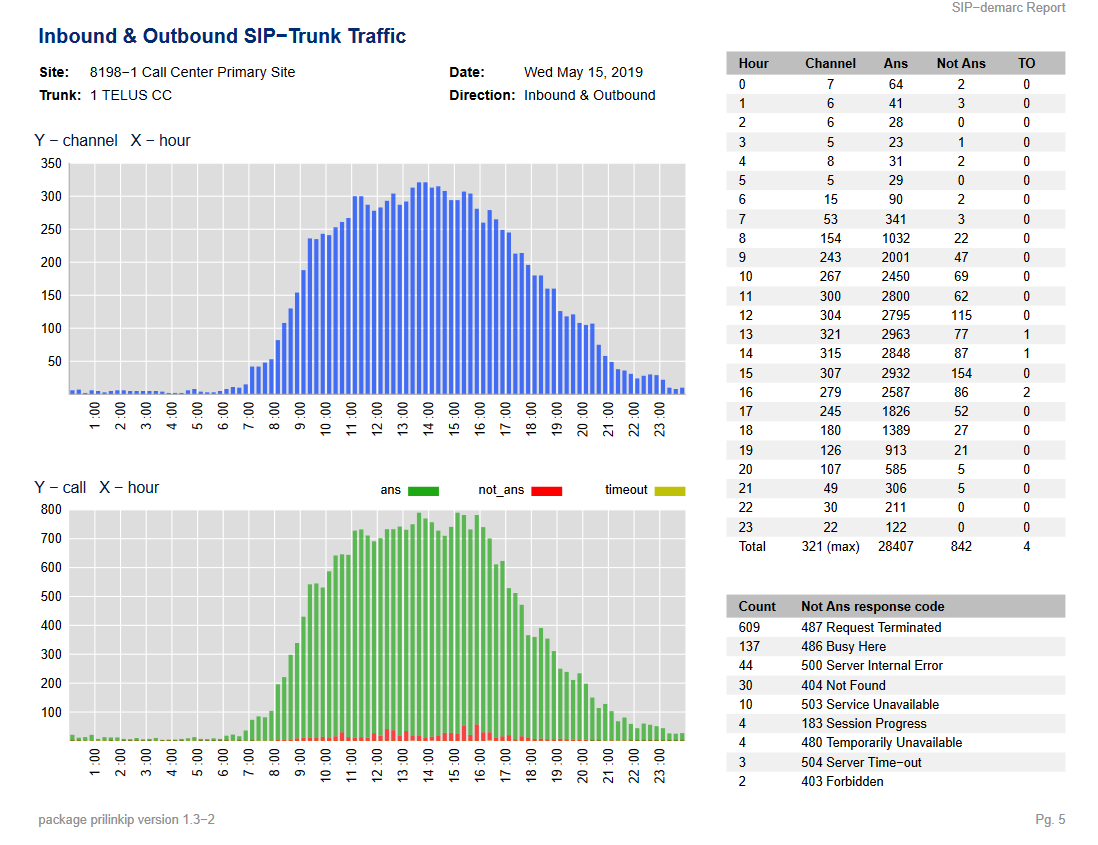
2. t-console is a self installed Windows application collecting NTA from 64 Demarc Points. You can be sure that data are ready for you to validate network compliance and QoS, identify disruptive endpoints and determine what caused connection issues to customers.

|

|
| GUI to analyze IP and SIP endpoint traffic and TCP/UDP/SIP/RTP/SRTP QoS | Non-intrusively capture IP packets from Demarc to examine SIP header, SDP and other protocols, even in peak live traffic. |

|
|
| IP and SIP Trunk telemetry showing service level, bandwidth usages and QoS | R-report highlights network and endpoint performances, csv files are available for export to business KPI systems. |
3. t-dashboard is optional. It is a front-line view of network traffic at Demarc that differentiates traffic anomalies from trends at a glance. Built on AWS QuickSight platform, it can be shared online with colleagues and vendors to monitor and optimize network operations collaboratively.

|

|
| Internet Dashboards summarizes network performance from physical (MAC) to transport layers and identify endpoint traffic anomalies over 14-day | IP endpoint telemetry visualizes bandwidth usage, packet counts, exposed TCP/UDP ports, RTP/SRTP packet loss and most active routes over 14-day |

|

|
| SIP Trunk Dashboards summarizes inbound and outbound traffic, call blockage, SIP response code, most active endpoints over 14-day. Also, you can download CDR with MOS score from dashboards. | SIP endpoint telemetry visualizes call volume, Demarc Point call blockage, peak hour channels, SIP response codes and more over 14-day |